
Reporting and Power BI
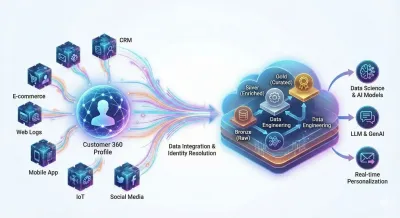
Customer 360
Creating a unified Customer 360 profile is not just a marketing goal, but a complex architectural challenge. This article analyzes the necessary transition to Data Lakehouse architecture in the Microsoft Fabric and Azure ecosystem. Learn how to build a modern data platform that serves as a robust foundation for advanced cloud analytics and hyper-personalized communications using AI and LLM.

Copilot in Microsoft Fabric and Power BI
Copilot in Microsoft Fabric and Power BI is fundamentally changing the way companies work with data. By generating reports, analyses, and DAX calculations using natural language, analytics becomes more accessible to business users and accelerates the path from question to decision. This article demonstrates the practical use of Copilot, its benefits for a modern data platform, and the limitations that must be considered from the perspective of data architecture and governance.

ROI of Data Projects
Data projects often fail not because the technology doesn’t work, but because their actual business impact isn’t measured or owned—according to Gartner, only 20% of analytical insights translate into concrete action. This article shows how to set goals and KPIs from the start, measure the baseline, continuously validate benefits, and avoid common pitfalls such as “solutions without adoption,” misinterpretation of data, or unrealistic expectations.

Creating dashboards in Power BI
A Power BI dashboard is useful when it shows users the status of key KPIs within seconds while also allowing them to quickly identify the causes of changes using filters, drill-through, and other interactions. In this article, we summarize practical principles for clear data visualization, the recommended structure for management reports, and common mistakes to avoid. We also take a look at the “backend”—how the dashboard fits into the corporate data platform on Azure (Azure SQL, Data Factory, Data Lake/Microsoft Fabric), and how to properly handle publishing, sharing, and security in the Power BI Service.
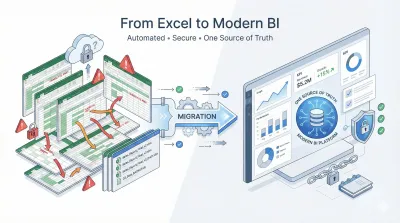
Migrating from Excel to Modern BI
Excel is a great tool for ad-hoc analysis, but it quickly reaches its limits when used for corporate reporting: errors, outdated data, versioning issues, and security risks. This article describes how to transition from manual spreadsheets to modern BI in order to establish a “single source of truth,” automated data flows, and controlled access to data. You’ll gain a practical migration methodology, from auditing Excel spreadsheets through designing a data model to a controlled switchover and user adoption.
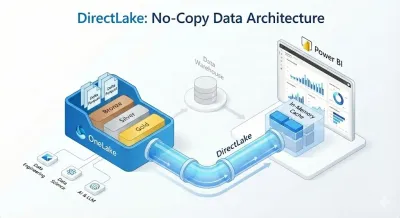
DirectLake in Power BI – Direct Access to Data Without Duplication
DirectLake in Power BI – Direct Access to Data Without DuplicationDirectLake takes Power BI to a new level where you no longer have to make the painful trade-off between import speed and the timeliness of DirectQuery. Data is read directly from OneLake in Microsoft Fabric, without unnecessary duplication into the data model and without lengthy scheduled refreshes that often slow down work with large datasets. The result is interactivity close to import mode, but with significantly fresher data and a simpler “single source of truth” architecture. In this article, we’ll explain how DirectLake technically works with Delta tables, where it typically delivers the greatest performance and cost benefits, and how it differs from DirectQuery in terms of latency, infrastructure load, and operational risks in an enterprise environment.